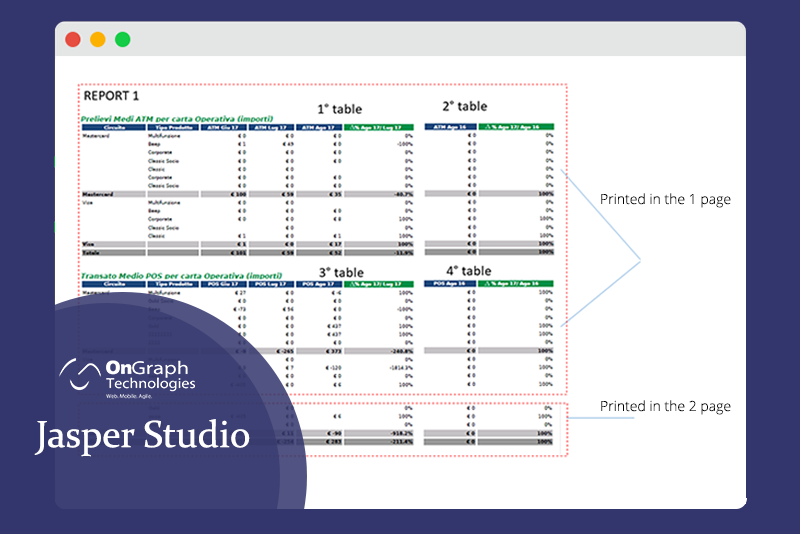
One of the most asked but least answered questions is how to print each row of a table on a separate page in Jasper Studio. Well, we have a step-by-step guide down below to answer your question.
Create a report Like separate.jrxml
To do that:
1. Click on file -> New -> Jasper Report
New Report wizards window open
2. Select Template Blank A4 and click on next.
New Report wizards report file window opens.
3. Select the folder in the workspace where you want to put the report, and name the report Like Separate.jrxml and click on the next button.
New Report wizards Data source window open.
4. Select data adapter Like: “Sample DB” and write query Like “Select * from address”;
New Report wizards’ Fields window opens.
5. After selecting fields click on next button
6. Click on the Finish button.
Note: After creating the Main Report, disable all bands except the Summary Band.
Create a table in a report
To create a table in a report:
1. Select the table element from the palette and drag it to the summary band. Dataset wizard open:
2. Select dataset name Like “dataset1” and select radio button “create a new dataset from a connection or data source” and click on next button.
3. Data source window open. Select data adapter “sample DB” and put the query like “select * from address” and click on the next button
4. The window opens. Select the fields which you want to show in the dataset and click on the next button.
5. Group by the window: Select fields which you want to use in a group and click on the next button.
6. Connection window opens: select option “use same connection used to fill the master report” and click on next button.
7. Table columns window open: Select fields which you want to use in the table and click on the finish button. Tables are generated in the summary band.
Connectivity to print each row on a separate page:
1. Click on dataset1 from the outline which is created for the table.
2. Click on Groups from dataset1
3. Select a field from groups which are used in table
4. Click on the properties tab and select the advanced tab
5. Edit property “start New Page” change it to true.
Conclusion:
This is how you print each row of a table on a separate page in Jasper studio. Need expert advice? Get in touch with OnGraph team.
FAQs
Q. What is Jasper Studio?
Jasper Studio is a tool for designing reports. It provides a visual interface for creating report layouts. Users can add data fields, images, and tables to their reports.
Q. How can I create reports in Jasper Studio?
- Design a report layout using drag-and-drop elements.
- Connect the report to a data source (like a database or XML file).
- Define queries to retrieve data for the report.
- Format the report to organize and present data effectively.
Q. What are the key features and benefits of using Jasper Studio for report design?
- Intuitive visual tools for designing reports.
- Support for various data sources, including databases and XML.
- Ability to create complex reports with charts and sub-reports.
- Extensive customization options for styling and formatting reports.
- Streamlines the report creation process for business analysis and decision-making.
Q. Are there any specific design or layout considerations I should keep in mind when setting up my Jasper Studio report to achieve this printing behavior?
Consider the following things-
- Maintain consistent layout and styling throughout the report.
- Ensure each row starts on a new page using page break settings.
- Adjust row heights and page size settings to fit content appropriately.
- Use Jasper Studio’s pagination settings to control how rows are distributed.
- Preview and test the report to confirm each row prints on its own page correctly.